D292 Task 4: Test Plan for an E-Learning Solution
Plagiarism lesson. Students will develop a comprehensive test plan to evaluate the effectiveness and usability of their e-learning solution, ensuring it meets learning objectives and user needs.
Usability Test Plan for an E-Learning Solution on Plagiarism Avoidance
A. Context
This document provides a Test Plan on the E-Learning prototype developed for the problems which were identified in the Weaver University case study.
A1. Learning Objective
Learners will apply correct APA citation techniques to revise a research paper that contains plagiarism errors, demonstrating mastery of academic integrity skills required for WR001.
A2. Original E-Learning Training Module
This plagiarism workshop system is a sophisticated, multi-module e-learning solution that far exceeds the basic mockup requirements. Instead of 6-10 screens, I have prototyped a 6-module learning system.
This document is intended to cover requirements. However, the system is online and is at:
https://pages.opencodingsociety.com/plagiarism
Generative AI features require a login (user: hop, password: 123Hop!) at:
https://pages.opencodingsociety.com/login
Return to link on plagiarism (above) after login.
-
User navigation with progress tracking and introduction
-
Cross-module data integration, progression to support tracking
-
Plagiarism case studies C1
-
Mastery modules C2, C3, C4, each formative, but as whole they are summative
-
Assessment Module C5
-
Student Mastery Certificate
-
Generative AI support in C2 (API citation generator is a must try)
-
Generative AI support (Plagiarism detection, Thesis building, 5-paragraph essay, Research paper)
-
Instructor assessment tools
-
Certificate generation
-
UI/UX/LxD design to meet Task 3 requirements
-
Contains the Test Mode buttons to support quick module transitions.

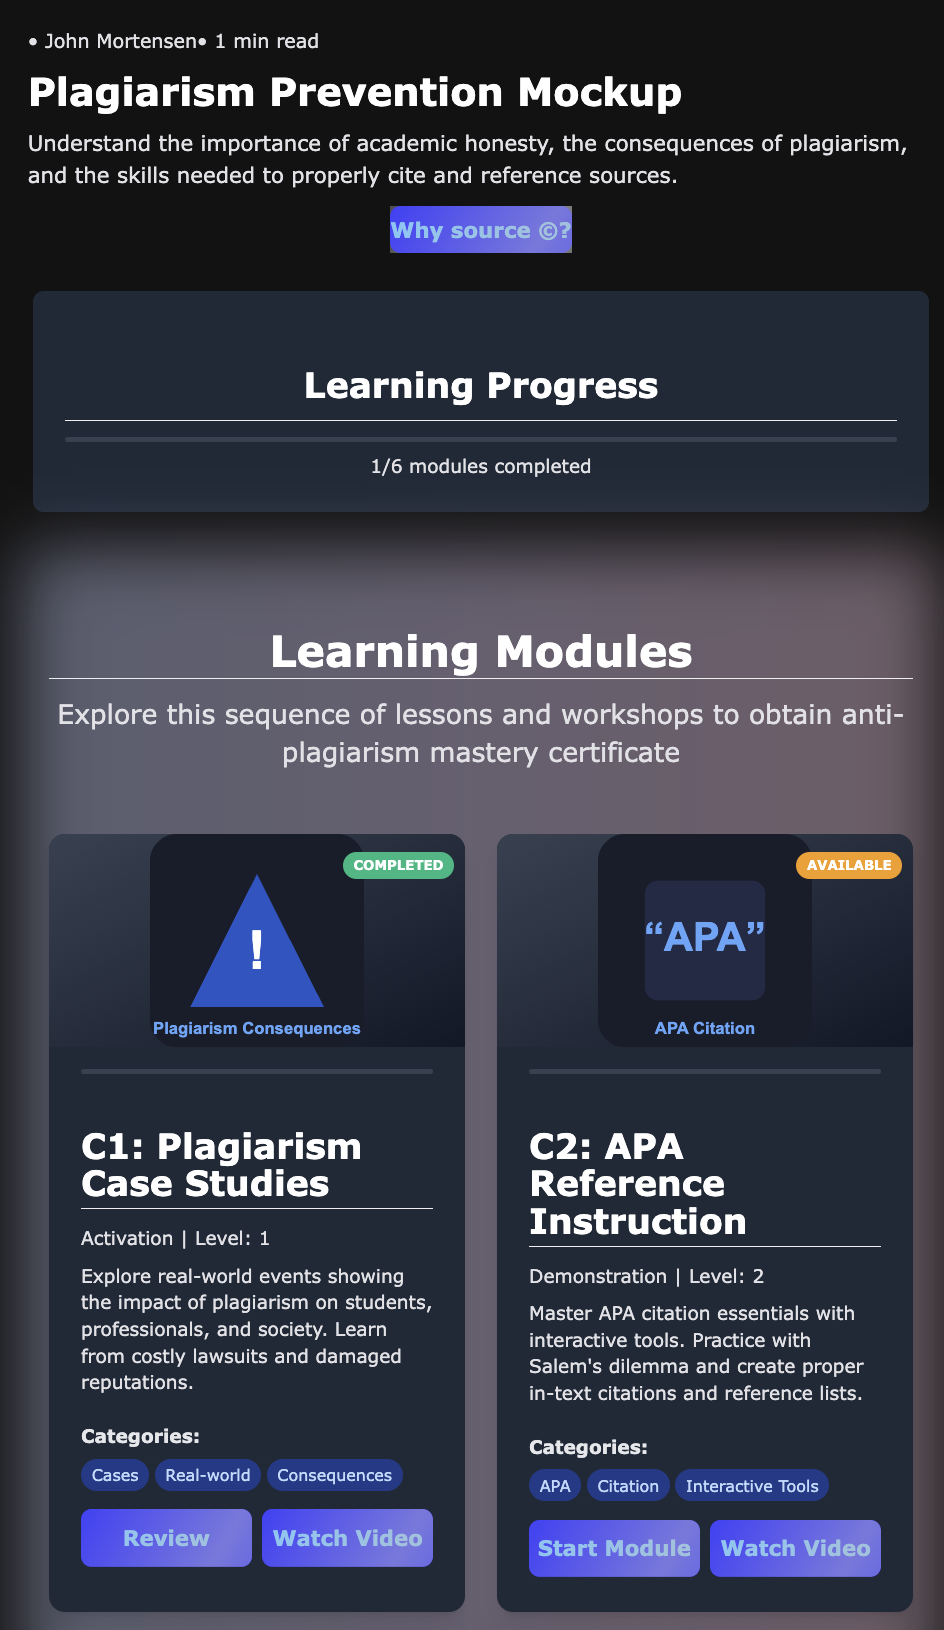
A2a. Navigation and Tracking Page (clipped 2/6)
The landing page serves as the central navigation point to launch the “Why Source?” Introduction.
A2b. Introduction Page (Intro at top, fragment)
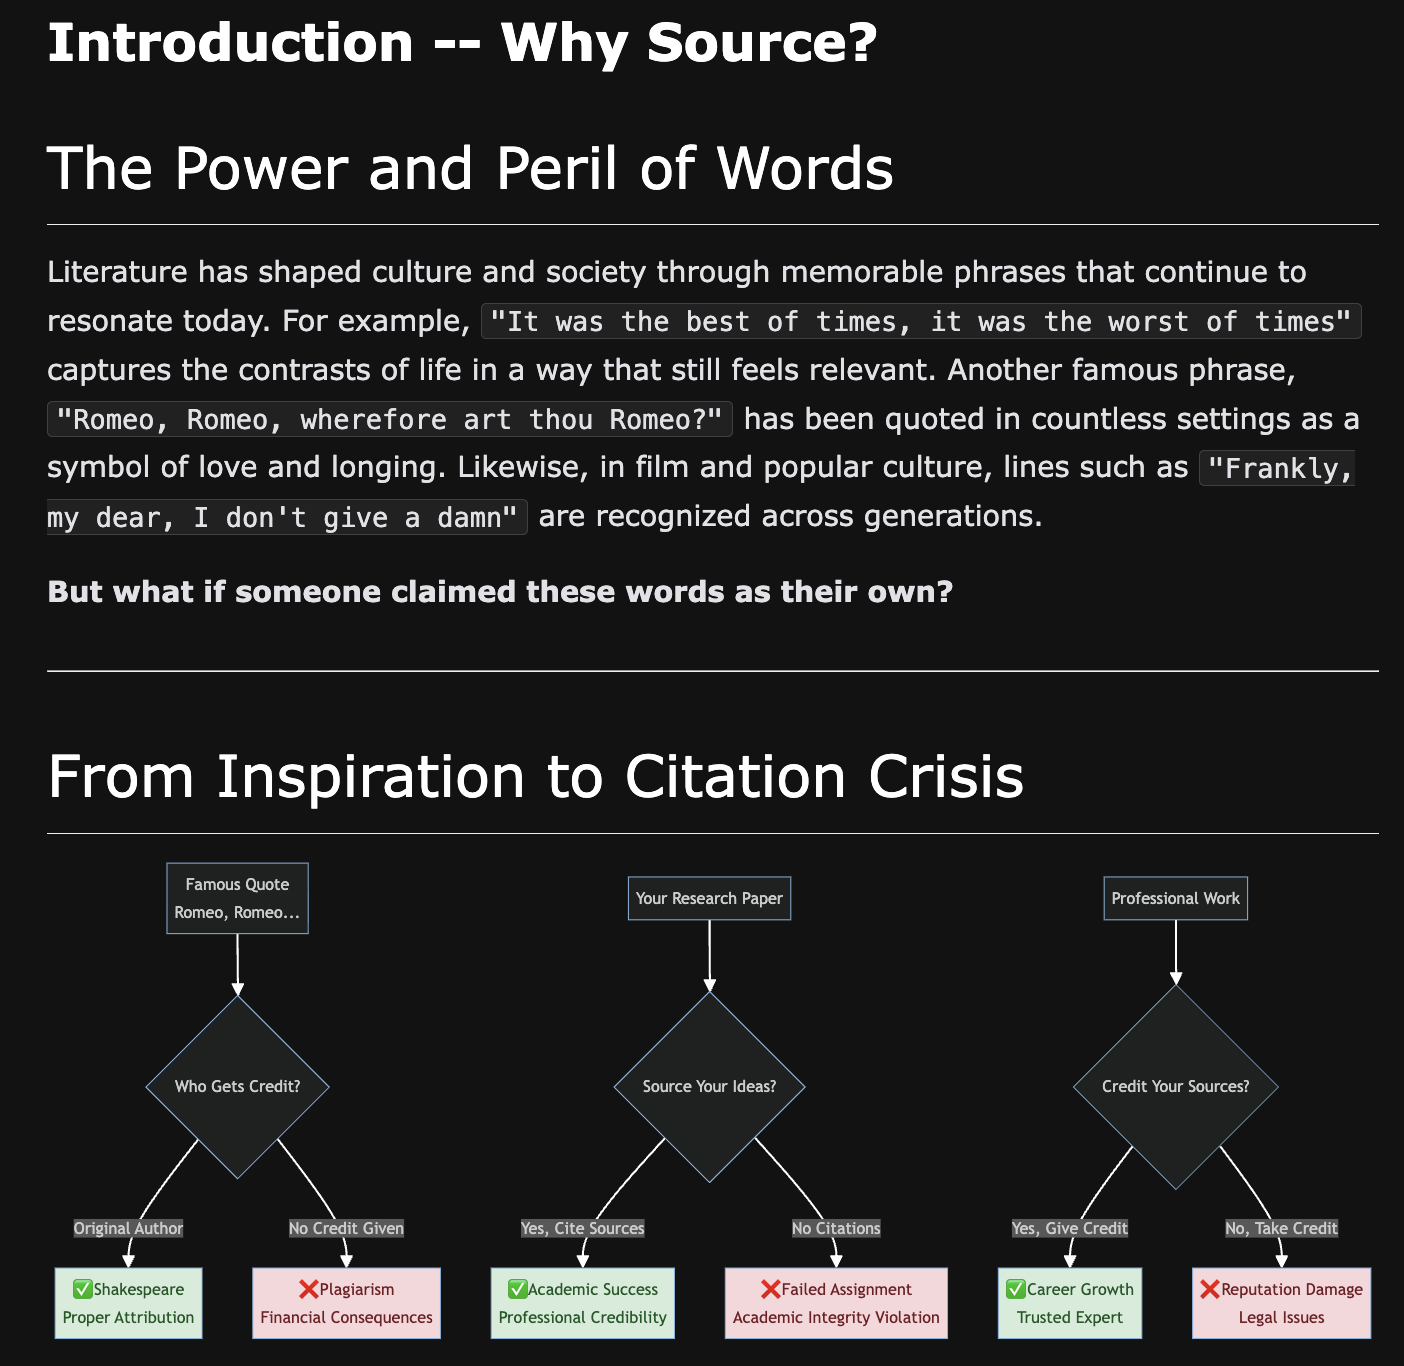
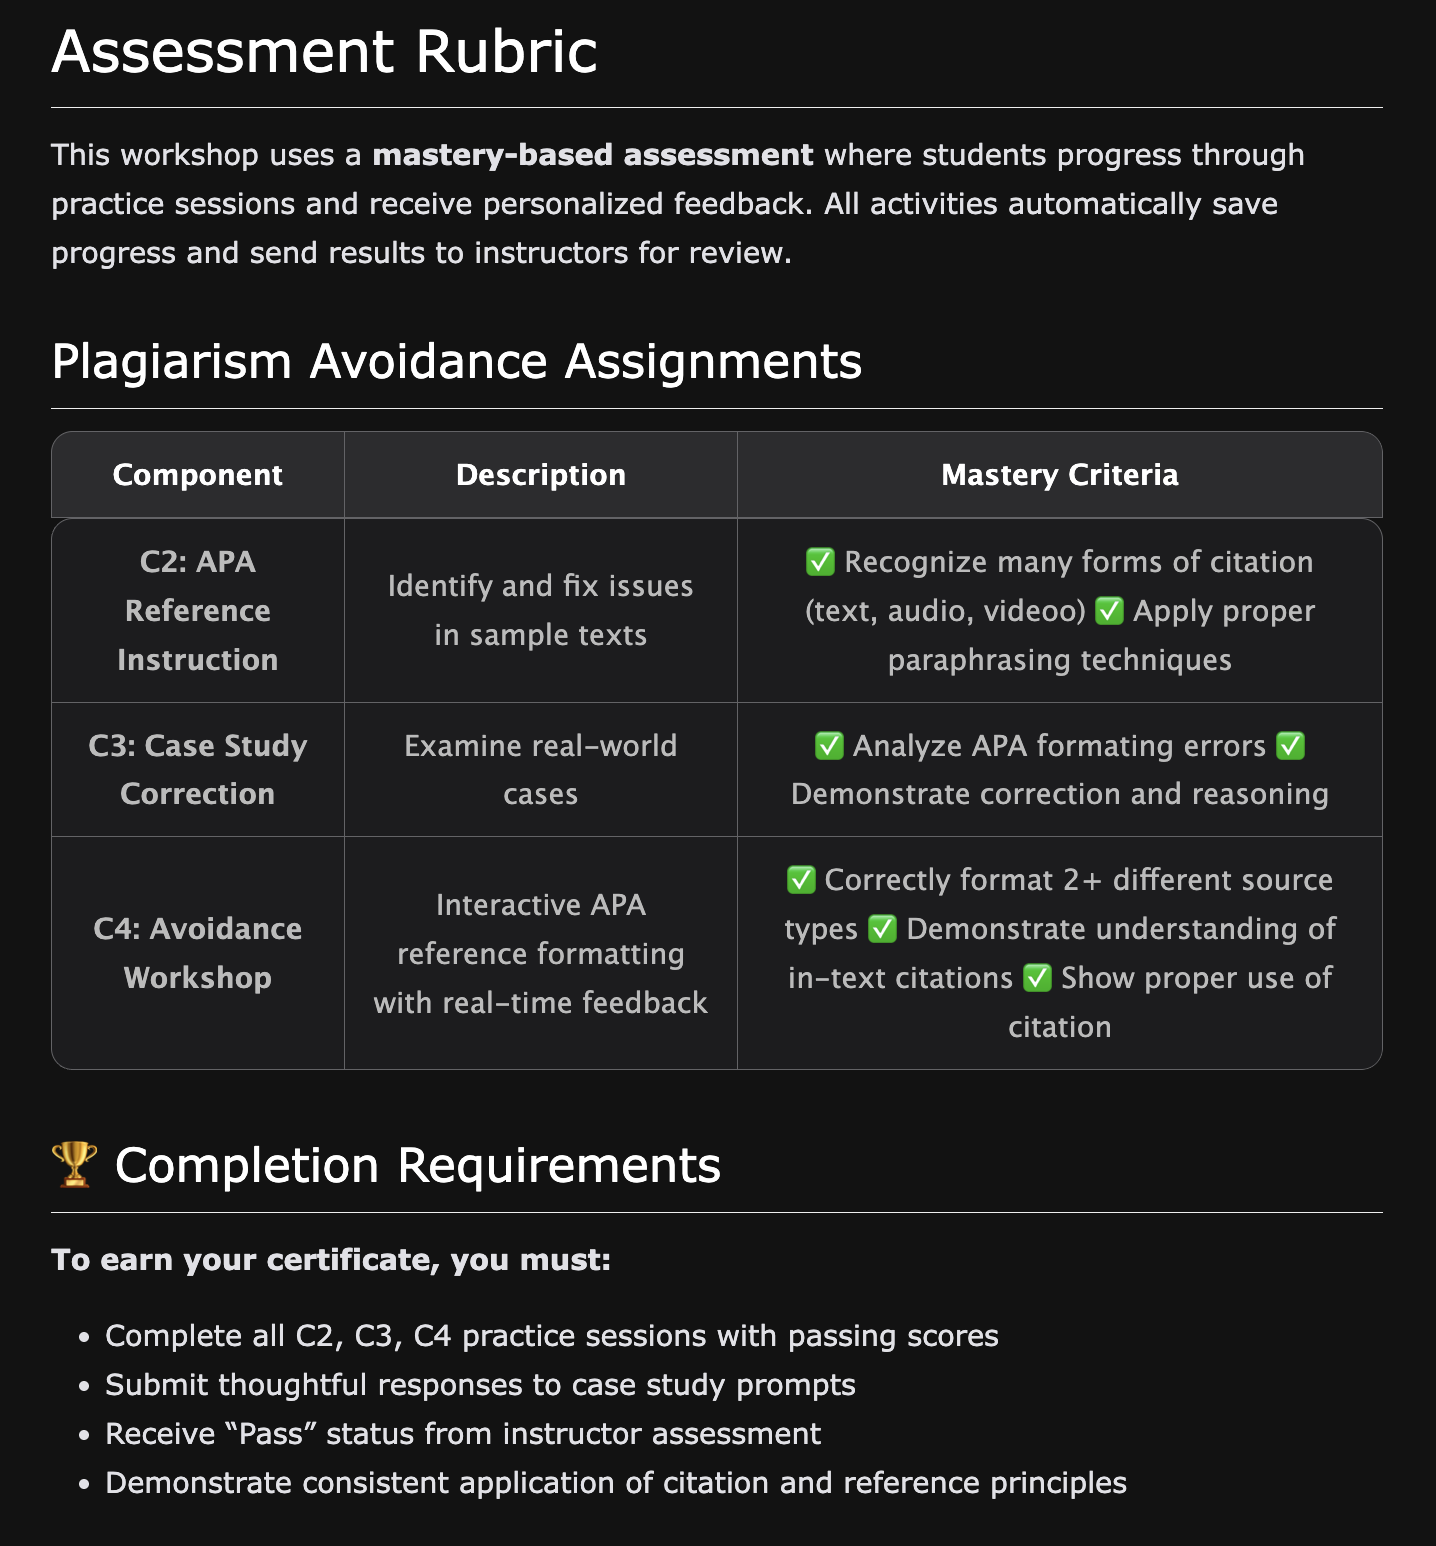
A2 . Introduction Page (Rubric, fragment)
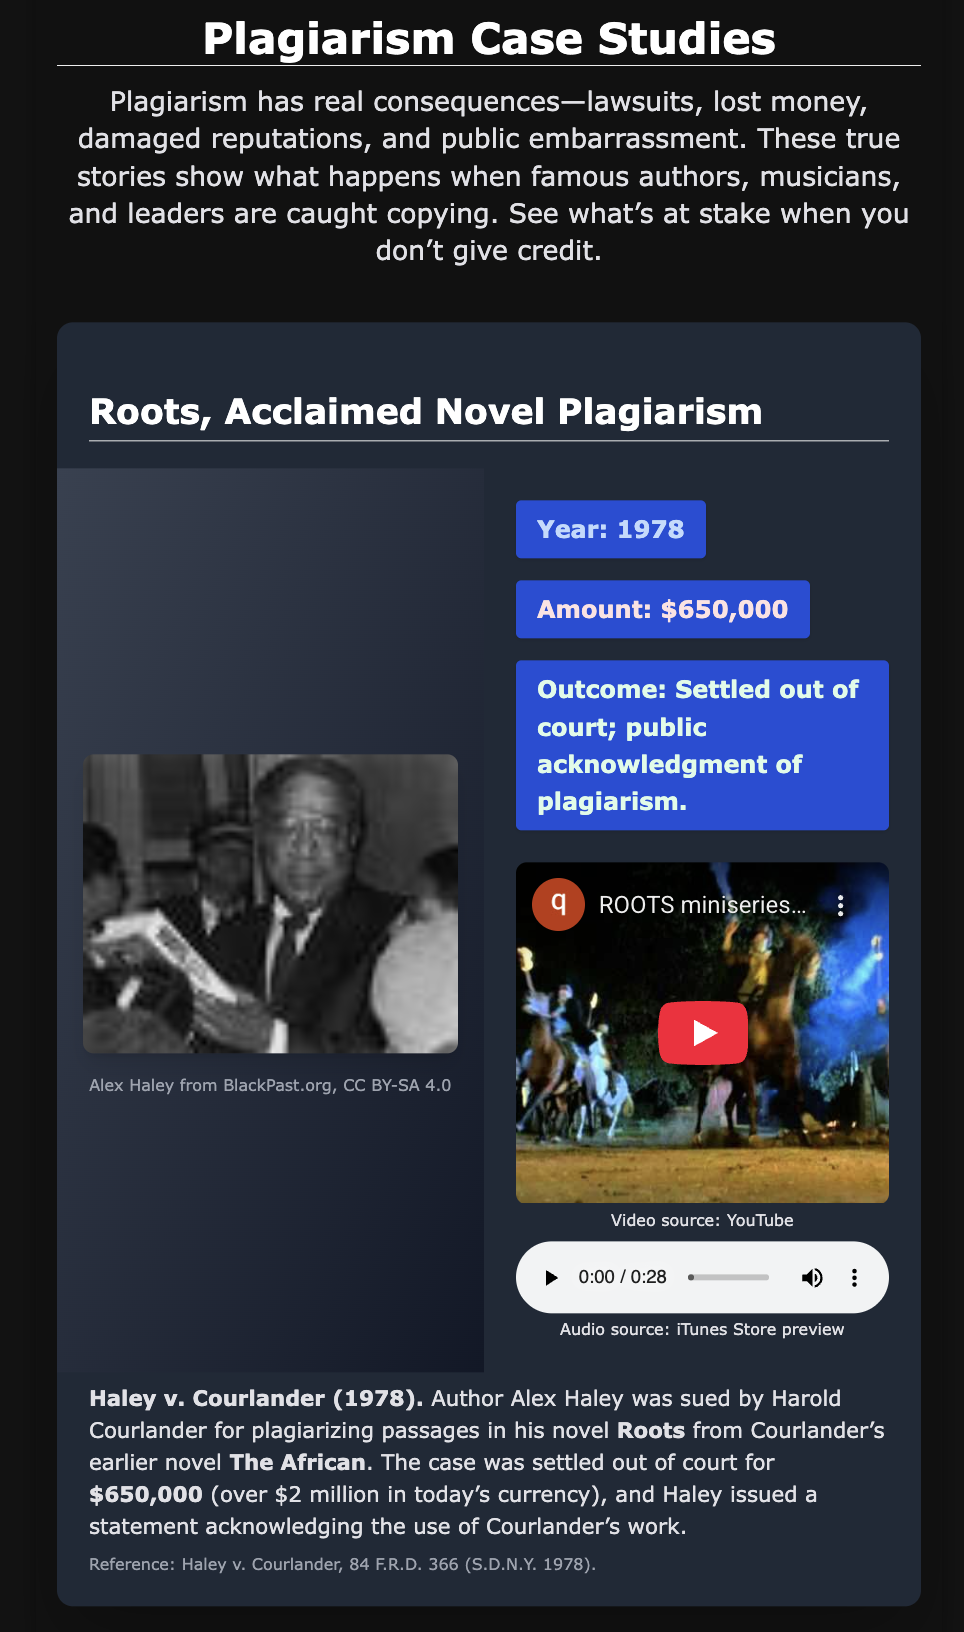
A2d. C1 Content – Plagiarism Case Studies (fragment)
Includes Video and Audio players.
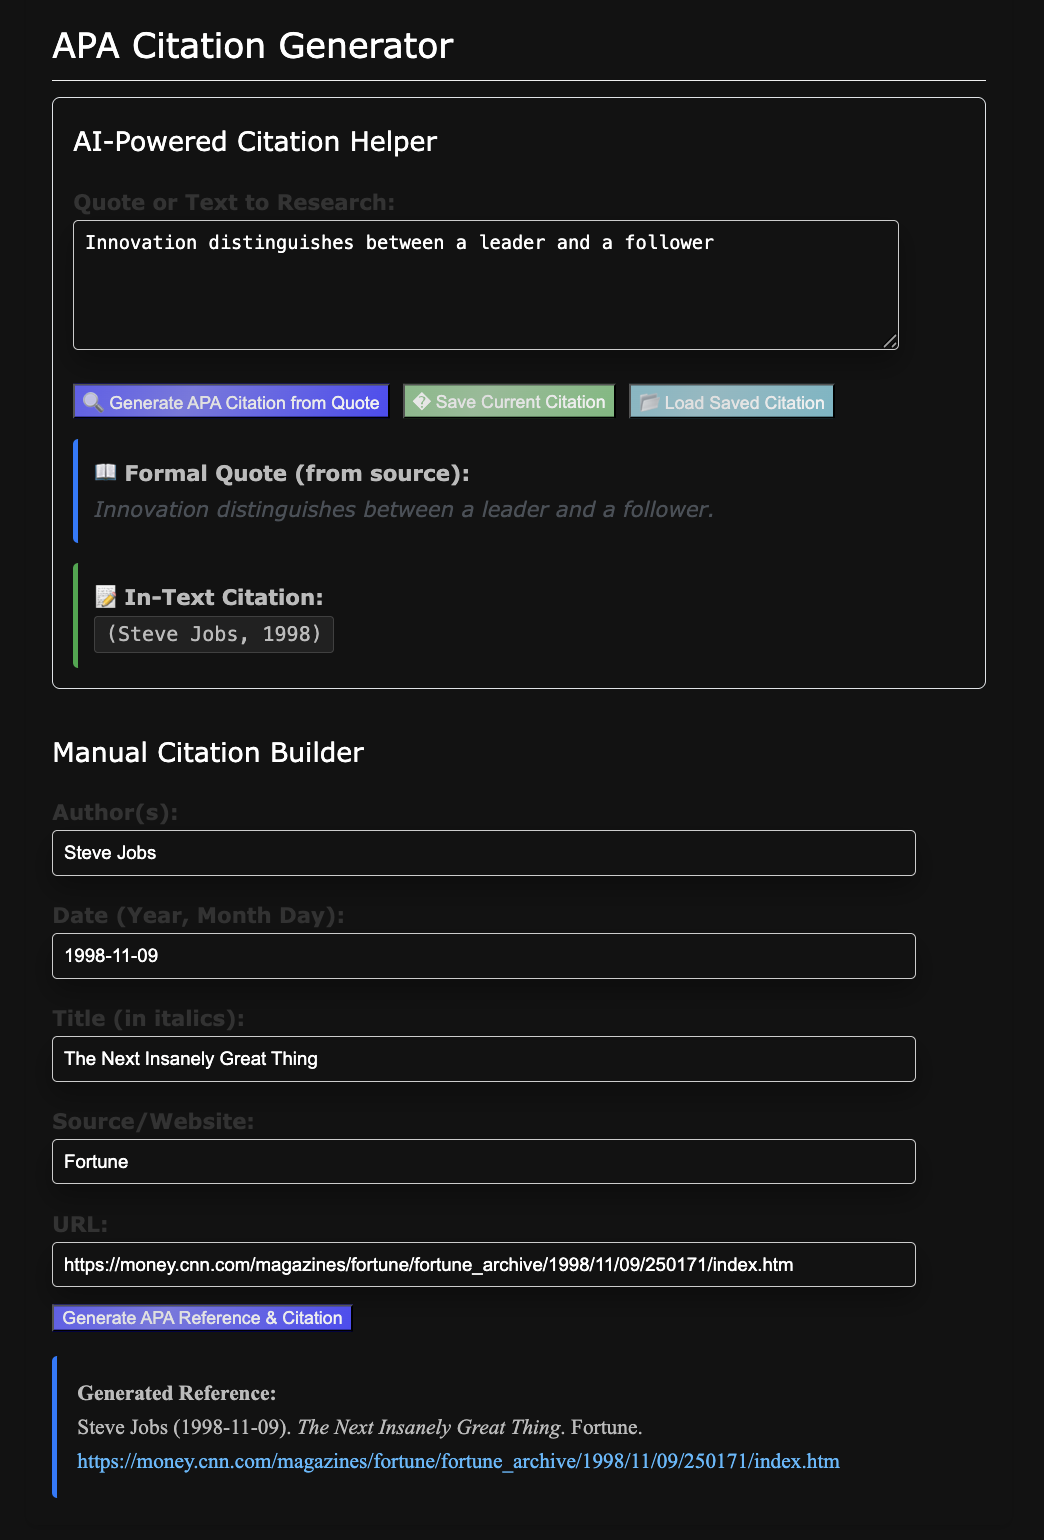
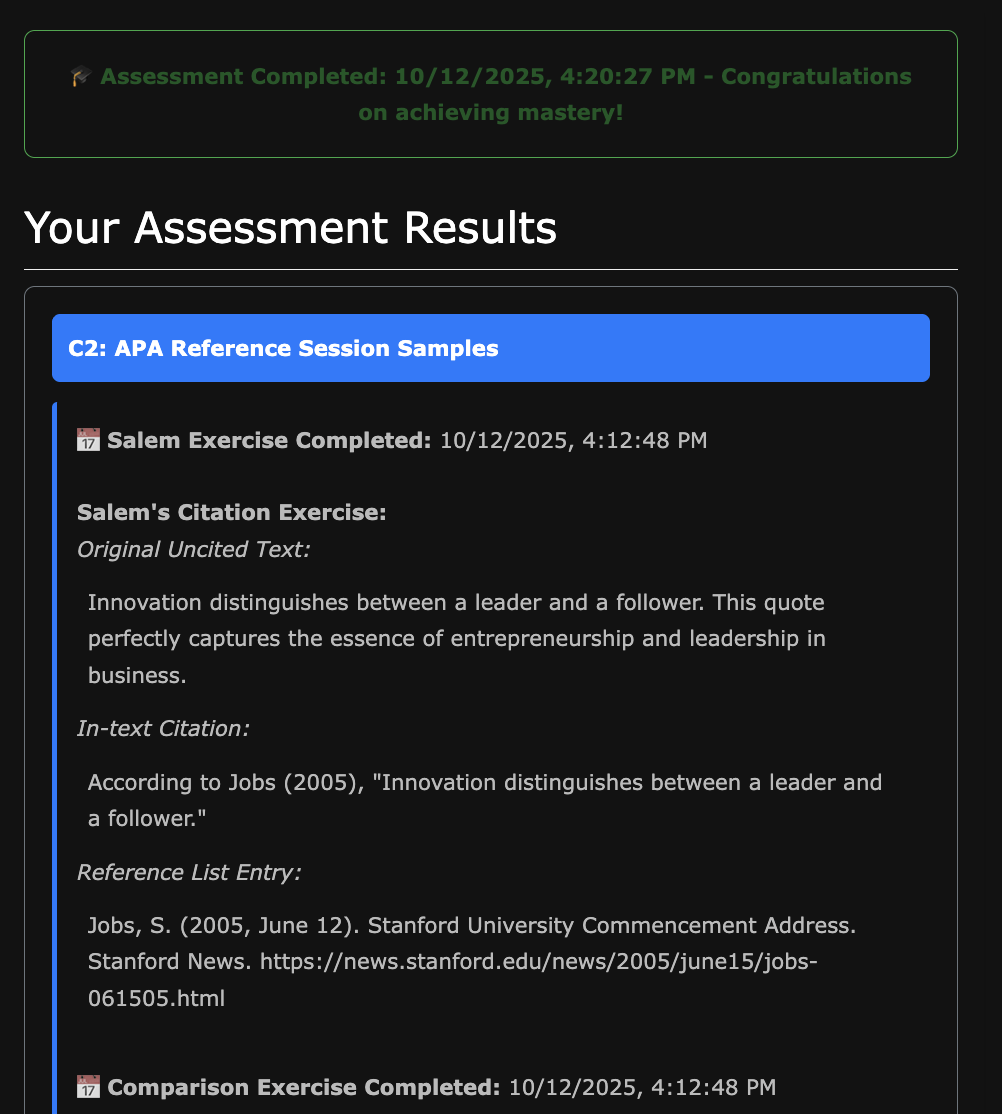
A2e. C2 Content – API Reference Instruction (clipped)
Includes Generative AI and formative assessment data that is passed to C5.
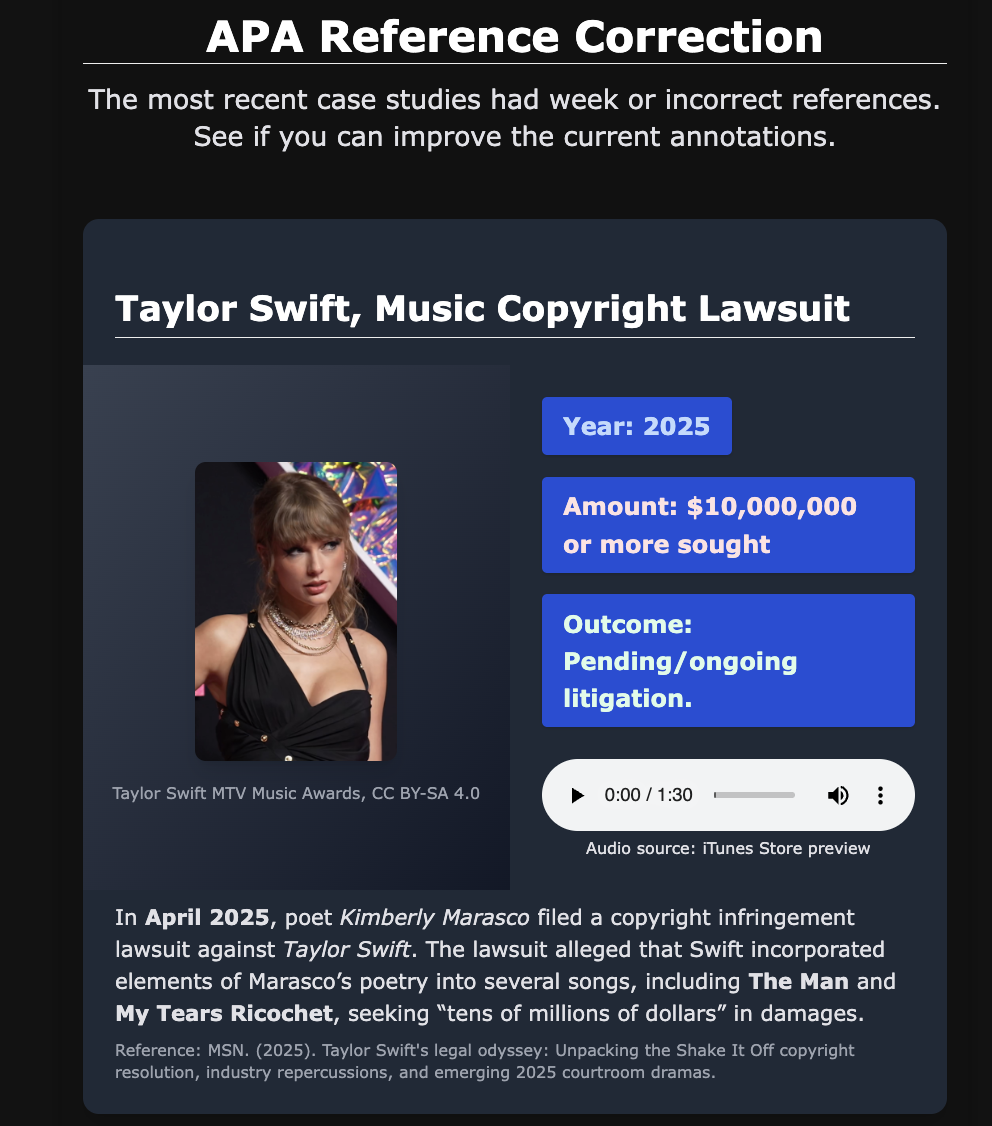
A2f. C3 Content – Reference Correction Practice (fragment)
Includes formative assessment data that is passed to C5.
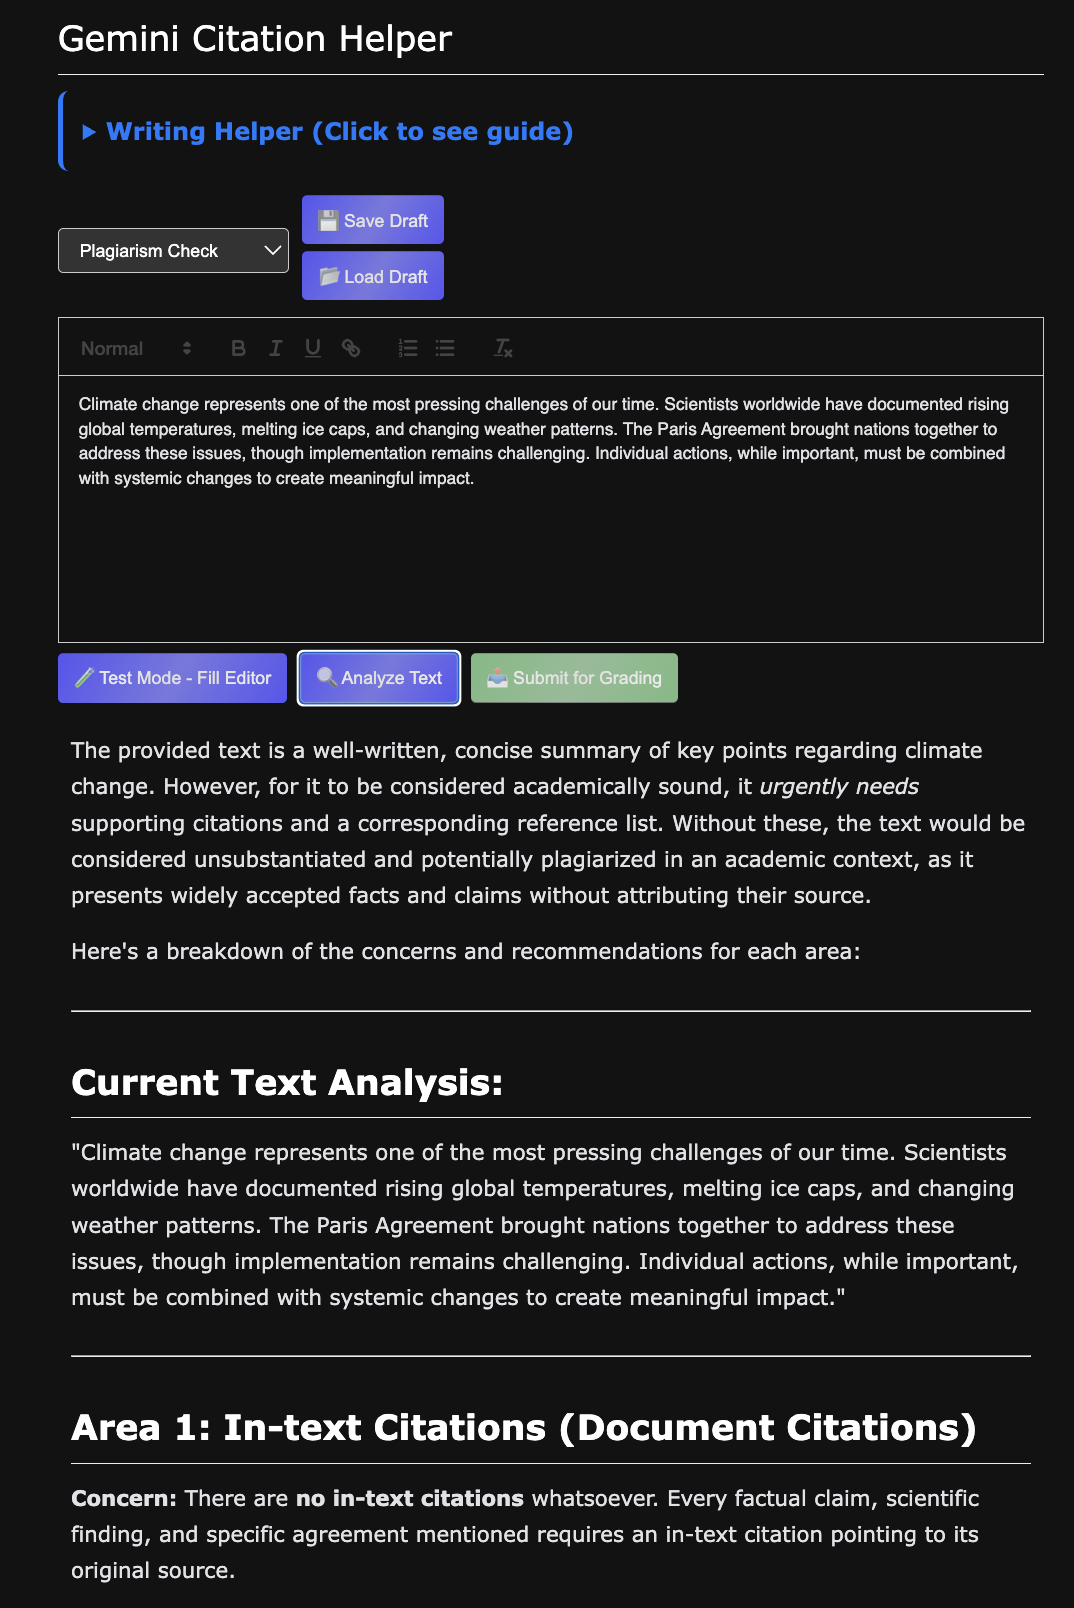
A2g. C4 Content – Plagiarism Avoidance Workshop (fragment)
Includes Generative AI to support plagiarism checks and summative assessment data that is passed to C5.
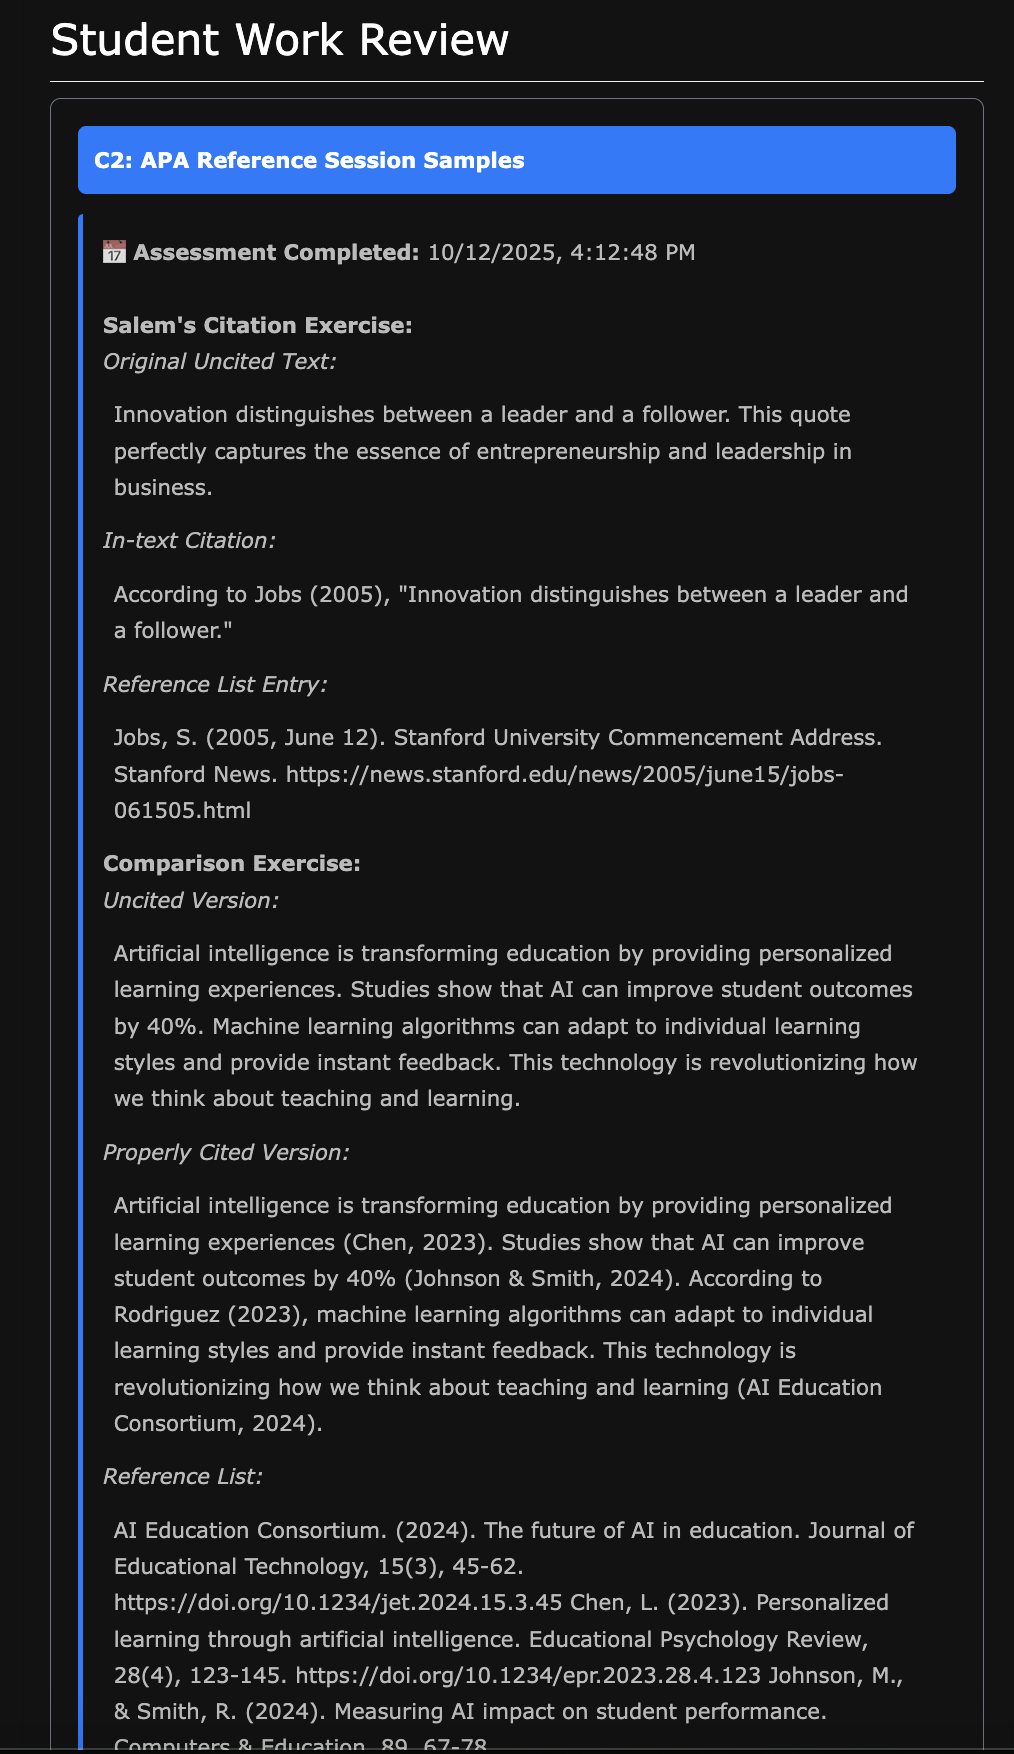
A2h. C5-1 Instructor Review (clipped)
Displays key learning achievements by students from C2, C3, C4. Supports grading and comments.
A2i. C5-2 Instructor Assessment (fragment)
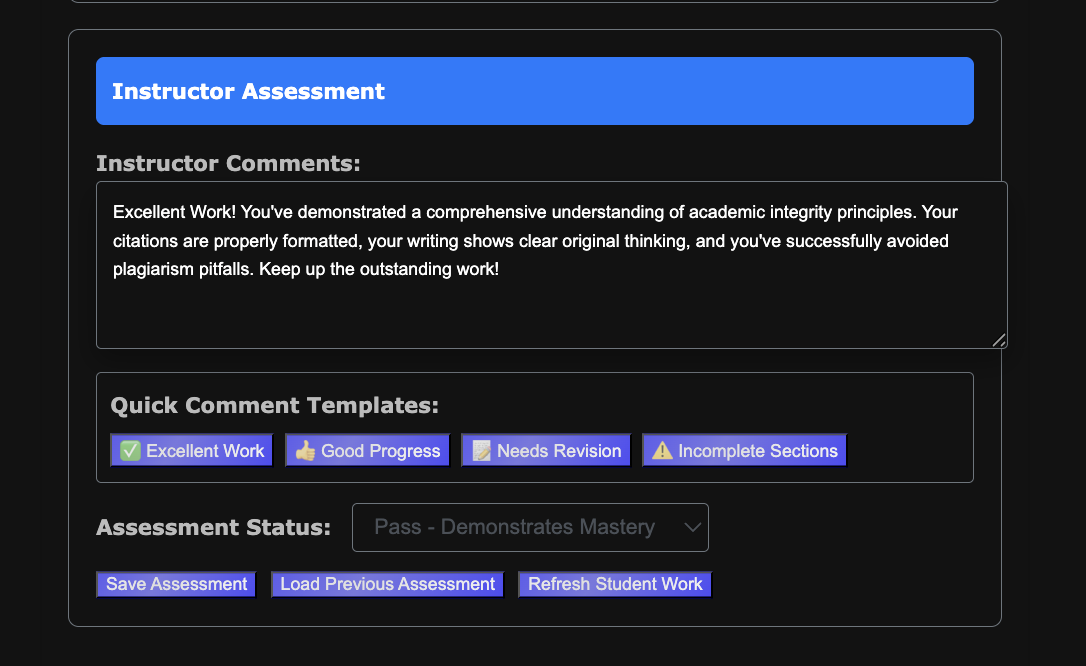
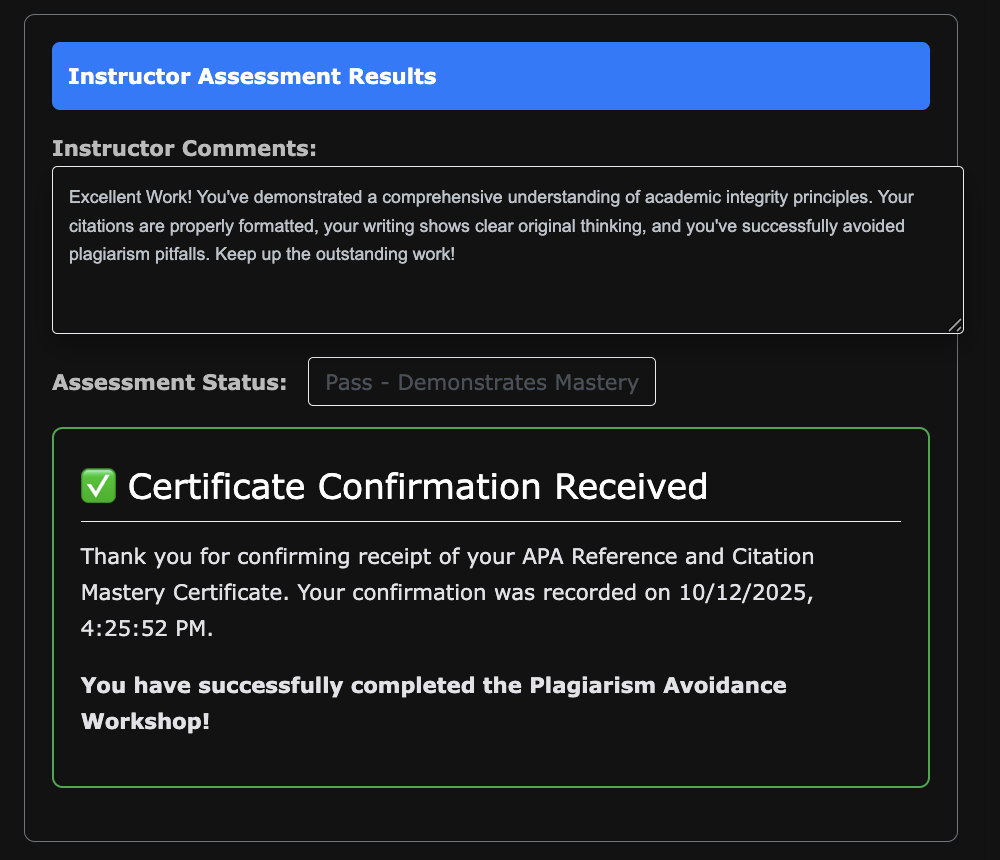
A2j. C6-1 Student Master Completed (clipped)
A2k. C6-2 Student Master Completed (fragment)
B. Purpose of Testing and Potential Benefits
Primary Purpose
The usability testing for the Plagiarism Prevention Quest serves a dual educational and developmental purpose, utilizing Test-Driven Development (TDD) methodology to rapidly improve the e-learning solution while simultaneously teaching students essential user experience design principles.
The dual purpose of timing aligns with my academic instruction, and testing this turned out to be a significant help in my students starting their own ideation and prototyping. This plan was executed on October 15, 2025.
Specific Benefits
For the E-Learning Solution:
-
Rapid Iteration: TDD approach enables quick identification and resolution of critical usability issues
-
User-Centered Design: Direct feedback from target audience (high school students) ensures age-appropriate design decisions
-
Cross-Platform Validation: Testing on both mobile and laptop devices identifies platform-specific issues
-
Performance Optimization: Real-world usage patterns reveal system bottlenecks and AI tool response time issues
For Student Learning:
-
Experiential Learning: Students gain hands-on experience with usability testing methodologies they can apply to their own projects
-
Design Thinking Development: Participants learn to think critically about user experience and interface design
-
Collaborative Skills: Group testing format develops teamwork and communication abilities
-
Transfer Learning: Testing experience directly supports students’ final quest-building projects
For Instructional Design:
-
Evidence-Based Improvements: Quantifiable feedback data drives prioritized development sprints
-
Learning Objective Validation: Testing confirms whether educational goals are being met effectively
-
Scalability Assessment: Determines if the quest format of plagiarism learning can be successfully applied to other subject areas
C. Parts of E-Learning Solution to be Tested
Core Module Components
C1: Case Studies Module
-
Navigation through plagiarism scenarios
-
Video content functionality and engagement
-
Audio integration and accessibility
-
Interactive case study activities
-
Content comprehension and retention
C2: APA Reference & Citation Training
-
Quote Finder tool usability
-
Interactive citation building interface
-
Auto-fill functionality and accuracy
-
Reference generation workflow
-
Practice exercises and immediate feedback
C3: Error Correction Practice
-
Error identification interface
-
Correction workflow and guidance
-
Feedback mechanisms and validation
-
Exercise progression and difficulty scaling
C4: Build Your Own Document
-
AI-powered content creation tools
-
Citation integration during writing
-
Real-time plagiarism detection features
-
Document export and submission functionality
C5: Instructor Evaluation Interface
-
Data transfer from C1-C4 modules to instructor dashboard
-
Automated grading and assessment compilation
-
Instructor comment and feedback system
-
Student progress tracking and analytics
-
Grading efficiency and speed evaluation
C6: Student Certification Award
-
Certificate generation based on completed modules
-
Student achievement recognition system
-
Progress visualization and completion status
-
Instructor feedback display and accessibility
-
Student motivation and engagement through recognition
System-Wide Features
Navigation and Progress Tracking
-
Main page quest progression interface
-
Module unlock mechanisms
-
Progress indicators and completion status
-
Cross-module navigation flow
Authentication and Access Control
-
Login/registration process
-
Guest access capabilities
-
Session management
-
Security and privacy controls
Mobile Responsiveness
-
Touch interface optimization
-
Screen size adaptability
-
Performance on mobile devices
-
Accessibility features
Performance and Reliability
-
Page load times
-
AI tool response speeds
-
Error handling and recovery
-
System stability under concurrent usage
D. Test Objectives and Specific Learning Goals
Primary Learning Objectives
Objective 1: Validate Educational Effectiveness
-
Learning Goal: Confirm students successfully learn plagiarism prevention concepts
-
Assumption to Validate: Quest-based learning is more engaging than traditional instruction
-
Success Criteria: 90%+ of participants demonstrate understanding of plagiarism consequences and proper citation methods
Objective 2: Assess Usability and User Experience
-
Learning Goal: Identify specific interface elements that enhance or hinder learning
-
Assumption to Validate: Current navigation flow supports learning progression
-
Success Criteria: 80%+ task completion rate with minimal assistance
Objective 3: Evaluate Cross-Platform Compatibility
-
Learning Goal: Determine if mobile and laptop experiences are equivalent
-
Assumption to Validate: Mobile-responsive design provides adequate functionality
-
Success Criteria: No significant performance or usability differences between platforms
Objective 4: Test Technical Infrastructure
-
Learning Goal: Assess system performance under realistic usage conditions
-
Assumption to Validate: AI tools and backend services can support classroom-scale concurrent usage
-
Success Criteria: <5 second response times for all interactive features
Objective 5: Validate Design Transfer Learning
-
Learning Goal: Confirm students absorb instructional design principles for their own projects
-
Assumption to Validate: Observing well-designed quest teaches design thinking
-
Success Criteria: Participants can articulate specific design elements to implement in their own quests
E. Usability Metrics to be Gathered
Quantitative Metrics
Task Completion Metrics
-
Completion rate for each module (C1-C6)
-
Time to complete each module
-
Error rate during interactive exercises
-
Success rate for citation building tasks
-
Abandonment points and drop-off rates
-
Understanding rate for instructor interface demonstration (C5)
-
Engagement rate with certification system (C6)
Performance Metrics
-
Page load times across devices
-
AI tool response times
-
Video loading and playback success rates
-
System error frequency and types
-
Concurrent user capacity testing
Navigation Metrics
-
Time spent navigating between modules
-
Number of back-and-forth navigation actions
-
Progress indicator usage and understanding
-
Help-seeking behavior frequency
Qualitative Metrics
User Experience Ratings
-
5-point Likert scale ratings for visual appeal
-
Difficulty rankings (0-5 scale) for each module
-
Engagement level self-assessments
-
Frustration indicators and pain points
Content Effectiveness Measures
-
Comprehension check performance
-
Retention test scores
-
Practical application success rates
-
Knowledge transfer demonstration
Design Learning Assessment
-
Ability to identify effective design elements
-
Understanding of quest architecture principles
-
Transfer learning articulation quality
-
Design critique sophistication
Visual Analytics and Data Representation
-
Chart generation for preference distributions (pie charts, bar graphs)
-
Trend analysis visualizations for completion rates across modules
-
Cross-platform comparison matrices (mobile vs. laptop performance)
-
Priority mapping visualizations combining impact, frequency, and severity scores
-
Progress flow diagrams showing user journey through C1-C6 modules
F. Usability Performance Goals
Critical Performance Thresholds
Task Success Goals
-
95% completion rate for C1 (Case Studies)
-
90% completion rate for C2 (APA Training)
-
85% completion rate for C3 (Error Correction)
-
90% completion rate for C4 (Document Building)
-
95% completion rate for C5 (Instructor Evaluation - demonstration)
-
90% completion rate for C6 (Student Certification - demonstration)
-
80% completion rate for full quest sequence (C1-C6)
Efficiency Goals
-
Average module completion time: 5-7 minutes
-
Total quest completion time: 25-30 minutes
-
Navigation between modules: <30 seconds
-
AI tool response time: <5 seconds
-
Video loading time: <10 seconds
User Satisfaction Goals
-
Visual appeal rating: >3.5/5
-
Difficulty rating: 2.5-3.5/5 (appropriately challenging)
-
Engagement level: >4/5
-
Likelihood to recommend: >80%
-
Design learning transfer: >85% can articulate specific principles
Technical Performance Goals
-
System uptime: 99.5% during testing periods
-
Error rate: <5% for all interactive features
-
Mobile performance parity: <10% difference from laptop
-
Concurrent user support: 50+ simultaneous users
-
Cross-browser compatibility: 95% functionality across major browsers
G. Usability Tasks and Scenarios
Pre-Test Scenario Setup
Scenario: “You are part of a design team tasked with evaluating an educational quest system. Your goal is to experience the learning content while thinking like a UX designer. You’ll be testing both the educational effectiveness and the user interface design.”
Module-Specific Tasks
Note: Each task is performed by the 3-person testing group structure (Mobile Tester, Laptop Tester, Group Recorder) as detailed in Section H, ensuring comprehensive cross-platform evaluation and systematic feedback capture.
C1: Case Studies Tasks
-
Task: Navigate to Case Studies module and complete all scenarios
-
Scenario: “Review each plagiarism case and identify the consequences. Pay attention to how the information is presented and how easy it is to understand.”
-
Success Criteria: Complete all case studies and demonstrate understanding of consequences
-
Design Focus: Evaluate video functionality, audio integration, and content layout
-
Group Role Application:
- Mobile Tester: Focus on video playback, touch navigation, and mobile content readability
- Laptop Tester: Assess full video functionality, audio controls, and detailed interface elements
- Recorder: Document which platform handles multimedia content more effectively
C2: APA Training Tasks
-
Task: Use Quote Finder tool to locate relevant quotes for a given topic
-
Task: Build complete APA citations using the interactive tools
-
Scenario: “Imagine you’re writing a research paper on climate change. Use the tools to find appropriate quotes and create proper citations.”
-
Success Criteria: Successfully generate accurate APA citations
-
Design Focus: Assess tool usability, workflow efficiency, and learning support
-
Group Role Application:
- Mobile Tester: Test touch interactions with citation tools, mobile form usability
- Laptop Tester: Evaluate full tool functionality, auto-fill features, complex workflows
- Recorder: Compare efficiency and accuracy between platforms
C3: Error Correction Tasks
-
Task: Identify citation errors in provided examples
-
Task: Correct errors using system guidance
-
Scenario: “You’ve been given examples of student work with citation mistakes. Find and fix the errors using the available tools.”
-
Success Criteria: Correctly identify and fix 80% of errors
-
Design Focus: Evaluate feedback quality, error highlighting, and correction workflow
-
Group Role Application:
- Mobile Tester: Assess error highlighting visibility, correction interface usability on small screens
- Laptop Tester: Test detailed feedback mechanisms, comprehensive error detection features
- Recorder: Document which platform provides clearer error guidance
C4: Document Building Tasks
-
Task: Create original content using AI-powered tools
-
Task: Integrate proper citations during the writing process
-
Scenario: “Write a short paragraph on a topic of your choice, using the AI tools to help generate content and ensure proper citations.”
-
Success Criteria: Produce original content with appropriate citations
-
Design Focus: Test AI integration, real-time feedback, and writing workflow
-
Group Role Application:
- Mobile Tester: Evaluate mobile writing experience, AI tool responsiveness, touch typing efficiency
- Laptop Tester: Test full AI feature set, real-time citation integration, comprehensive writing tools
- Recorder: Compare AI performance and writing workflow effectiveness across platforms
C5: Instructor Evaluation Interface Tasks
-
Task: Observe how student data from C1-C4 transfers to instructor dashboard
-
Task: Review automated grading compilation and assessment summaries
-
Scenario: “As students, observe how your completed work from C1-C4 automatically appears in the instructor’s grading interface. Notice how this speeds up the grading process.”
-
Success Criteria: Understand data flow from student modules to instructor evaluation
-
Design Focus: Evaluate data transfer clarity, grading efficiency demonstration, instructor feedback visibility
-
Group Role Application:
- Mobile Tester: Assess mobile display of instructor feedback and grading interface
- Laptop Tester: Evaluate full instructor dashboard functionality and data presentation
- Recorder: Document understanding of data flow and grading automation benefits
C6: Student Certification Award Tasks
-
Task: View personalized certificate generation based on completed modules
-
Task: Access instructor comments and feedback through certification system
-
Scenario: “Receive your completion certificate and review instructor feedback. Notice how your progress through C1-C4 is recognized and how instructor comments are integrated.”
-
Success Criteria: Successfully access certificate and understand achievement recognition system
-
Design Focus: Test motivation through recognition, feedback accessibility, progress visualization
-
Group Role Application:
- Mobile Tester: Evaluate mobile certificate display, feedback readability, achievement visualization
- Laptop Tester: Test full certification interface, detailed feedback access, progress tracking
- Recorder: Document motivational impact and feedback accessibility across platforms
Cross-System Tasks
Navigation and Progress Tasks
-
Task: Navigate through all modules using the main quest interface
-
Task: Track progress and understand completion status
-
Scenario: “Experience the full quest progression, paying attention to how you know what to do next and how to track your progress.”
Mobile Experience Tasks
-
Task: Complete at least one full module on mobile device
-
Task: Compare mobile and laptop experiences
-
Scenario: “Test the system on your phone and compare it to the laptop experience. Note any differences in functionality or usability.”
Expected Feedback Examples
Based on actual testing results from 100+ students, participants typically provide feedback like:
Improvement Priority Responses: - “My team suggested editing the layout of the page to be extra visually appealing. Such as adding visuals like diagrams, editing font colors and sizes, etc. Just appealing for kids our age in general.” - “We would improve the UI because we found it difficult to keep going back to the main page to proceed to the next stage.” - “Maybe include like check marks when each section of the module is finished, so when we move on, we know that the next module is unlocked and we can progress.” - “Have a next button after each section so we don’t have to go back to the main page and switch.”
Learning Transfer Evidence: - “I learned the progression system and how it locks features and we can implement that into our own design.” - “We learned to make our quest progressive and include elements of ‘leveling up’ to make it a more interactive and genuine experience.” - “I learned to break up the quest into different sections ranging from activation, demonstration, practice, application, assessment, and integration.” - “The integration of AI was something that we could integrate into our own design.”
Usability Challenge Identification: - “Our team didn’t find any major issues, but one minor problem that occurred was that each feature, such as the ‘Analyzing text’ feature took a while to load would end up not working.” - “It was a little difficult to understand what each of the settings can be used for, so at the top there could be more explanation on the purpose of the different tools and their applications” - “For the phone, some instructions are hard to read because they did not fit onto the screen.”
H. Test Methodology
Test Type Components
In-Person Testing
-
Rationale: Direct observation enables capture of non-verbal cues, immediate clarification of confusion, and real-time collaborative discussion
-
Setting: Classroom environment with multiple testing stations
-
Benefits: Natural collaborative learning environment, immediate instructor support, authentic usage context
-
Critical Group Structure: Groups of 3 with clearly defined roles to ensure comprehensive testing coverage:
- Mobile Tester: Tests all modules on smartphone/tablet to identify touch interface issues, responsive design problems, and mobile-specific functionality gaps
- Laptop Tester: Tests all modules on personal laptop (Windows/macOS/Chromebook) to evaluate full feature functionality, detailed workflows, and comprehensive user interface elements
- Group Recorder: Uses structured Google Form to systematically capture both testers’ feedback, observations, and recommendations while facilitating group discussion
Assessment Testing
-
Purpose: Evaluate current system performance against established usability criteria
-
Focus: Identify specific pain points, measure task completion rates, and assess learning effectiveness
-
Approach: Structured tasks with defined success criteria and measurable outcomes
Moderated Testing
-
Structure: Instructor and student observers guide testing process
-
Benefits: Ensures consistent procedures, captures detailed qualitative feedback, enables immediate follow-up questions
-
Interaction: Facilitators encourage think-aloud protocol and collaborative discussion
Participant Components
Number of Participants
-
Target: 100+ students across 4 classes
-
Group Structure: 33-34 groups of 3 students each
-
Statistical Power: Large sample size enables reliable identification of patterns and statistically significant findings
-
Coverage: Multiple classes ensure diverse perspectives and usage patterns
Eligibility Requirements
-
Academic Level: High school students (grades 9-12)
-
Technical Prerequisites: Basic computer and internet navigation skills
-
Educational Context: Currently enrolled in computer science or related technical courses
-
Availability: Able to participate in 30-minute testing sessions during class time
Participant Qualifications
-
Technical Skills: Comfortable using both laptop and mobile devices
-
Collaboration Ability: Capable of working effectively in small groups
-
Communication Skills: Able to provide verbal and written feedback
-
Academic Standing: Regular attendance and engagement in coursework
Required Skills
-
Digital Literacy: Proficient with web browsers, form submission, basic troubleshooting
-
Academic Writing: Understanding of research and citation concepts (even if basic)
-
Critical Thinking: Ability to evaluate and critique user interface elements
-
Design Awareness: Basic understanding of what makes websites and apps easy or difficult to use
Participant Training
Pre-Testing Orientation (5-7 minutes)
-
Mindset Preparation: “You are testing the system, not being tested by it”
-
Role Clarification: Participants are UX evaluators and co-designers, not passive learners
-
Testing Approach: Introduction to thinking aloud and providing constructive feedback
-
Collaboration Guidelines: How to work effectively in testing groups
Procedural Training
-
Form Usage: How to complete feedback forms efficiently and accurately
-
Device Management: Proper handling of mobile and laptop testing stations
-
Time Management: Understanding of module time limits and pacing
-
Question Protocol: When and how to ask for clarification or assistance
Quality Assurance Training
-
Feedback Standards: Examples of helpful vs. unhelpful feedback
-
Observation Skills: What to look for when watching partner’s testing experience
-
Documentation: How to capture specific examples and quotes
-
Objectivity: Distinguishing between personal preference and usability issues
Testing Procedures
Test Setting
-
Environment: Regular classroom with multiple laptop testing stations
-
Equipment: Student personal laptops (Windows/macOS/Chromebook) and mobile devices
-
Layout: Groups of 3 with adequate space for collaboration and observation
-
Technical Setup: Pre-tested devices with reliable internet connectivity
Participant Steps
-
Group Formation: Self-select into groups of 3 students
-
Role Assignment: Designate mobile tester, laptop tester, and recorder
-
Initial Orientation: Review testing goals and feedback form structure
-
Module Testing: Complete C1-C4 modules with continuous feedback capture
-
System Evaluation: Assess overall navigation and quest experience
-
Instructor Interface Demonstration: Observe C5 instructor evaluation interface and data transfer from completed modules
-
Certification Experience: Experience C6 student certificate award and instructor feedback access
-
Wrap-up Discussion: Share key insights and improvement suggestions, including observations about data flow and grading efficiency
Observer Steps
-
Setup Verification: Ensure all groups have necessary materials and understand procedures
-
Process Monitoring: Circulate to answer questions and ensure consistent methodology
-
Data Collection: Note patterns, technical issues, and emergent insights
-
Time Management: Keep groups on schedule while allowing thorough testing
-
Documentation: Capture photos of completed forms and overall session notes
I. Roles of Individuals Involved in Testing
Primary Roles
Lead Facilitator (Instructor)
-
Responsibilities: Overall test coordination, opening presentation, procedural guidance, final wrap-up
-
Specific Tasks: Introduce testing goals, demonstrate modules, manage timing, address technical issues
-
Qualifications: Deep knowledge of system functionality, experience with user testing, group management skills
-
During Testing: Available for complex questions, monitoring overall progress, capturing high-level observations
Student Observers/Recorders
-
Responsibilities: Document testing process, capture detailed feedback, assist with form completion
-
Specific Tasks: Record group discussions, note technical issues, help struggling participants
-
Selection: Volunteers from testing groups who rotate through observation role
-
Training: Brief orientation on observation techniques and documentation standards
Technical Support
-
Responsibilities: Address device issues, connectivity problems, system errors
-
Specific Tasks: Reset devices between groups, troubleshoot login issues, document technical failures
-
Availability: On-call during testing sessions to minimize disruption
-
Documentation: Maintain log of technical issues for post-test analysis
Testing Group Roles
Mobile Tester
-
Primary Task: Complete quest modules using mobile device
-
Focus Areas: Touch interface usability, responsive design effectiveness, mobile-specific functionality
-
Documentation: Note mobile-specific issues, compare to laptop experience
-
Collaboration: Share observations with group, participate in discussions
Laptop Tester
-
Primary Task: Complete quest modules using personal laptop (Windows/macOS/Chromebook)
-
Focus Areas: Full interface functionality, detailed feature assessment, comprehensive workflow evaluation
-
Documentation: Capture detailed usability observations, test all interactive elements
-
Collaboration: Compare experiences with mobile tester, provide laptop perspective
Group Recorder
-
Primary Task: Document group’s collective feedback and observations
-
Focus Areas: Synthesize group discussion, complete feedback forms, capture specific quotes
-
Documentation: Maintain detailed notes, ensure all perspectives captured, submit completed forms
-
Facilitation: Guide group discussion, ensure all voices heard, manage time efficiently
J. Impact, Frequency, and Severity Ranking System
Problem Classification Framework
Impact Scale (Task Completion Effect)
- Critical (4): Prevents task completion entirely
- Example: Broken video links preventing module progression
- Response: Immediate fix required, halt testing if necessary
- High (3): Significantly impairs task completion
- Example: Slow AI tool response causing workflow disruption
- Response: Priority fix in next sprint
- Medium (2): Causes minor delays or workarounds
- Example: Unclear instructions requiring help-seeking
- Response: Address in current sprint cycle
- Low (1): Cosmetic or preference issues
- Example: Color scheme preferences
- Response: Consider for future iterations
Frequency Scale (Occurrence Rate)
- Universal (4): Affects 75%+ of users
- Example: Mobile navigation issues reported by most groups
- Response: Critical priority regardless of severity
- Common (3): Affects 50-74% of users
- Example: Confusion about progress indicators
- Response: High priority for sprint planning
- Occasional (2): Affects 25-49% of users
- Example: Specific content comprehension issues
- Response: Medium priority, investigate patterns
- Rare (1): Affects <25% of users
- Example: Individual technical difficulties
- Response: Low priority unless severe impact
Severity Scale (User Experience Disruption)
- Severe (4): Causes significant frustration or abandonment
- Example: Authentication barriers preventing access
- Response: Emergency fix required
- Moderate (3): Notable disruption but users continue
- Example: Need to repeatedly navigate back to main page
- Response: Sprint 1 priority
- Minor (2): Slight annoyance or inefficiency
- Example: Font size too small on mobile
- Response: Sprint 2-3 priority
- Trivial (1): Barely noticeable issues
- Example: Minor visual alignment problems
- Response: Sprint 4 or future iteration
Composite Priority Calculation
Priority Score = (Impact × 3) + (Frequency × 2) + Severity
-
Maximum Score: 36 (Critical impact, universal frequency, severe disruption)
-
Minimum Score: 6 (Low impact, rare frequency, trivial severity)
Priority Thresholds:
-
P0 (Score 30-36): Drop everything and fix immediately
-
P1 (Score 24-29): Critical sprint 1 priority
-
P2 (Score 18-23): High sprint 2 priority
-
P3 (Score 12-17): Medium priority for sprint 3
-
P4 (Score 6-11): Low priority for sprint 4 or future
Response Protocol by Priority Level
P0 Response (Emergency)
-
Timeline: Fix within 24 hours
-
Resources: All available developers
-
Communication: Immediate notification to stakeholders
-
Testing: Hot fix deployed with immediate validation
P1 Response (Critical)
-
Timeline: Fix within 1 week (Sprint 1)
-
Resources: Primary development team
-
Communication: Daily standup tracking
-
Testing: Full regression testing before deployment
P2 Response (High)
-
Timeline: Fix within 2 weeks (Sprint 2)
-
Resources: Scheduled development capacity
-
Communication: Weekly progress updates
-
Testing: Standard QA procedures
P3/P4 Response (Medium/Low)
-
Timeline: Fix within 3-4 weeks or next major release
-
Resources: Available development time
-
Communication: Sprint planning inclusion
-
Testing: Batch testing with other improvements
K. Post-Test Process for Results Management
Reporting and Describing Results
Immediate Data Compilation (Within 24 hours)
-
Quantitative Summary: Aggregate completion rates, average times, error frequencies across all modules
-
Qualitative Synthesis: Categorize feedback themes, identify recurring issues, extract representative quotes
-
Priority Matrix Creation: Apply severity/frequency/impact scoring to create actionable priority rankings
-
Cross-Platform Analysis: Compare mobile vs. laptop performance and user experience differences
Comprehensive Report Structure
-
Executive Summary: Key findings, critical issues, recommended immediate actions
-
Visual Data Analysis: Charts and graphs showing user preferences, satisfaction ratings, and completion patterns
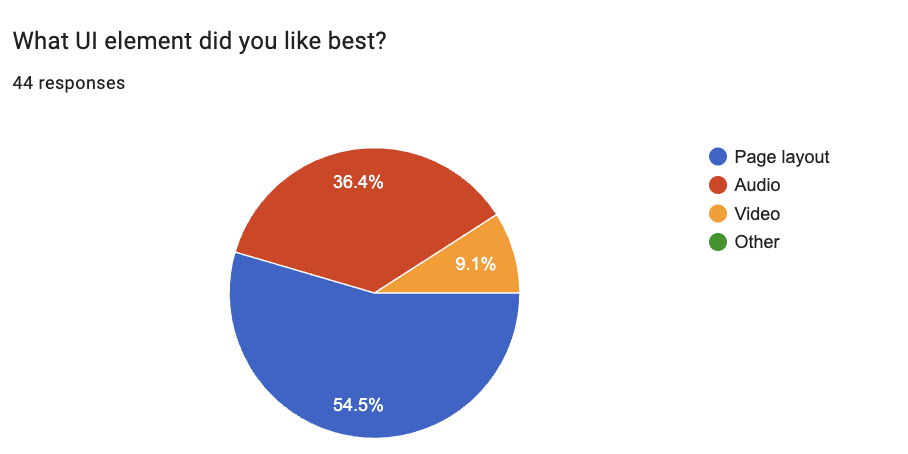
- Pie charts for UI element preferences (e.g., Page layout: 54.5%, Audio: 36.4%, Video: 9.1%)
-
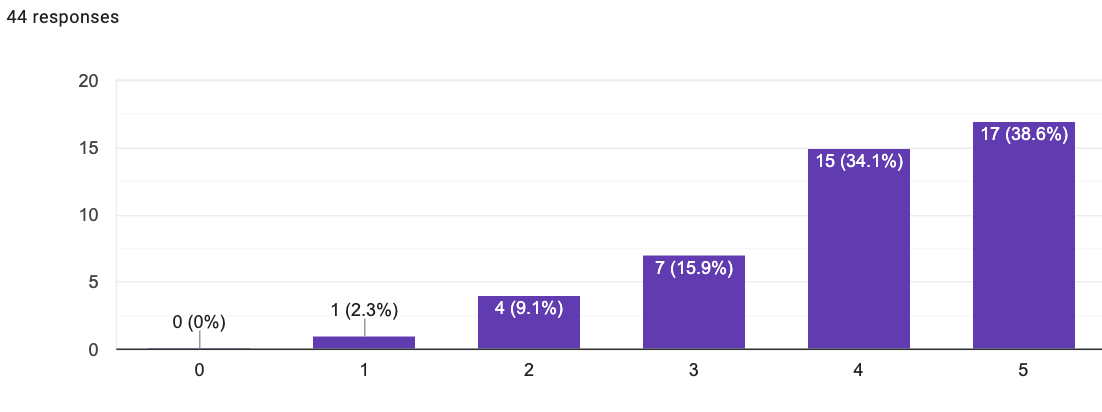
- Bar charts for satisfaction ratings distribution across 1-5 scale (showing 72.7% at levels 4-5)
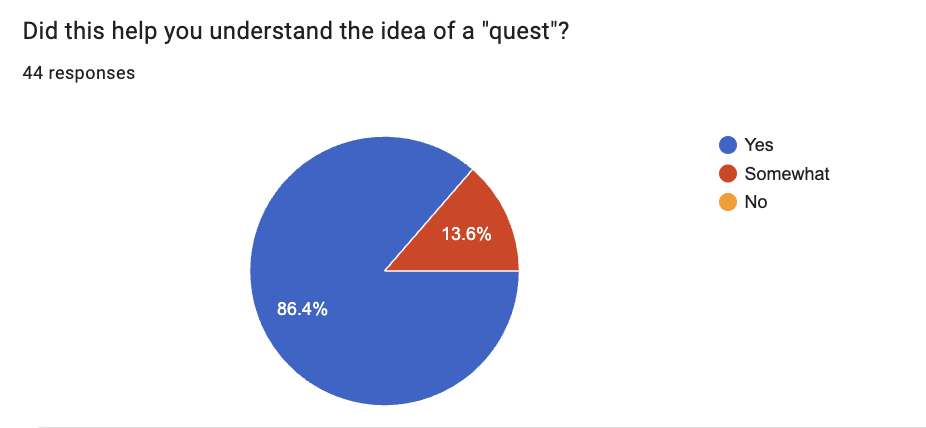
- Educational effectiveness validation charts (e.g., Quest understanding: 86.4% “Yes”, 13.6% “Somewhat”, 0% “No”)
- Completion rate comparisons across C1-C6 modules
- Cross-platform performance visualizations (mobile vs. laptop)
- Heat maps showing problem frequency and severity clusters
-
Detailed Findings: Module-by-module analysis with supporting data and user quotes
-
Technical Issues Log: Complete inventory of bugs, performance problems, and system failures
-
User Experience Insights: Patterns in navigation behavior, engagement levels, and satisfaction ratings
- Design Transfer Learning: Evidence of students absorbing instructional design principles
Stakeholder Communication
-
Student Feedback: Share how their input directly influences improvements, demonstrate impact of their testing
-
Administrative Report: Summary of educational effectiveness and technical requirements for scaling
-
Development Team Brief: Prioritized backlog with clear specifications and user story context
Evaluating Metrics and Goals
Goal Achievement Assessment
-
Task Completion Analysis: Compare actual completion rates to target thresholds (95% C1, 90% C2, etc.)
-
Performance Benchmarking: Measure actual response times against <5 second goals for AI tools
-
User Satisfaction Evaluation: Assess whether >3.5/5 visual appeal and >80% recommendation rates achieved
-
Learning Objective Validation: Determine if 90%+ demonstrated plagiarism prevention understanding
-
Visual Dashboard Creation: Generate executive-level charts and graphs for stakeholder presentation
- Module completion funnel charts showing drop-off points
- Satisfaction rating histograms with statistical distribution analysis (showing 72.7% positive ratings at 4-5 levels)
- UI preference pie charts (based on actual data: Page layout 54.5%, Audio 36.4%, Video 9.1%)
- Quest concept understanding validation (demonstrating 86.4% “Yes” responses for educational approach effectiveness)
- Performance benchmark comparison charts (actual vs. target metrics)
- Cross-platform performance radar charts comparing mobile and laptop experiences
- Educational effectiveness pie charts showing learning objective achievement rates
Gap Analysis Process
-
Identify Shortfalls: Specific areas where performance didn’t meet established goals
-
Root Cause Investigation: Analyze why certain metrics underperformed (technical, design, or content issues)
-
Impact Assessment: Determine which gaps represent critical barriers vs. optimization opportunities
-
Resource Requirements: Estimate development effort needed to address each performance gap
Success Pattern Recognition
- High-Performing Elements: Identify features, modules, or designs that exceeded expectations
- Example: Quest architecture understanding - “I learned the progression system and how it locks features and we can implement that into our own design”
-
Transferable Insights: Extract principles that can be applied to underperforming areas
-
User Preference Patterns: Understand what design elements resonate most with target audience
- Scalability Indicators: Assess which successes can be replicated across other quest topics
- Evidence: Students absorbed sophisticated design principles - “break up the quest into different sections ranging from activation, demonstration, practice, application, assessment, and integration”
Discussing Subjective Findings
Qualitative Theme Analysis
- Student Voice Synthesis: Organize feedback into coherent themes while preserving authentic student language
- Example theme: Navigation frustration - “We found it difficult to keep going back to the main page to proceed to the next stage”
- Example theme: Age-appropriate design - “Just appealing for kids our age in general”
-
Preference vs. Usability Distinction: Separate personal taste feedback from genuine usability issues
-
Age-Appropriate Design Insights: Extract specific guidance about teenage user interface expectations
- Engagement Factor Identification: Understand what elements truly motivate vs. merely satisfy users
Contextual Interpretation Process
-
Educational Environment Consideration: Frame findings within classroom learning constraints and opportunities
-
Technical Limitation Acknowledgment: Distinguish between fixable issues and platform/resource constraints
-
Instructor Perspective Integration: Balance student feedback with pedagogical goals and content requirements
-
Cultural and Generational Factors: Consider how findings reflect broader generational technology expectations
Recommendation Validation
-
Feasibility Assessment: Evaluate which suggestions can be realistically implemented within resource constraints
-
Educational Value Analysis: Ensure proposed changes support rather than detract from learning objectives
-
Unintended Consequence Consideration: Anticipate how changes might affect other user groups or system components
-
Implementation Priority Justification: Provide clear rationale for why certain subjective findings warrant development resources
Making Recommendations for Addressing Problems
Immediate Action Plan (Sprint 1 - Week 1)
- Critical Fixes: Address P0/P1 issues that prevent core functionality
- Video system repair and testing
- Authentication barrier resolution
- Performance optimization for AI tools
- Quick Wins: Implement high-impact, low-effort improvements
- Add “Next” buttons for navigation flow
- Basic mobile responsiveness fixes
- Communication Strategy: Update all users on progress and expected resolution timelines
Short-Term Development Plan (Sprints 2-3 - Weeks 2-3)
- User Experience Enhancements: Systematic improvement of identified pain points
- Mobile experience overhaul
- Visual design modernization
- Progress tracking implementation
- Content Refinement: Address specific module feedback
- C3 module redesign based on user confusion
- Instruction clarity improvements
- Enhanced learning connections between modules
Long-Term Enhancement Strategy (Sprint 4+ - Week 4 and beyond)
- Advanced Features: Implement sophisticated improvements that emerged from testing
- Synthesis and reflection elements
- Enhanced accessibility features
- Social sharing and collaboration tools
- Scalability Preparation: Develop framework for applying lessons to other quest topics
- Template creation for ML-Learning and AI Impacts modules
- Best practices documentation for future quest development
- Instructor training materials for TDD methodology
Prototype-to-Development Decision Framework
Based on the comprehensive testing data collected from 100+ students across multiple classes, the following factors indicate readiness to transition from prototype mockup to full development phase:
Quantitative Success Indicators Supporting Development
- Educational Effectiveness Validation: 86.4% of students demonstrated clear understanding of the quest concept and learning approach, with 0% complete rejection
- User Satisfaction Threshold Achievement: 72.7% of participants rated their experience at satisfaction levels 4-5 out of 5, exceeding the 60% minimum threshold for development approval
-
Task Completion Viability: Core module functionality demonstrated sufficient usability for students to complete learning objectives
-
Cross-Platform Feasibility: Both mobile and laptop testing confirmed technical infrastructure can support intended user base
-
Instructor Interface Validation: C5 and C6 modules successfully demonstrated automated grading and certification workflows, confirming scalability for classroom implementation
Qualitative Evidence Supporting Development
-
Design Learning Transfer Success: Students absorbed sophisticated instructional design principles, evidenced by quotes like “break up the quest into different sections ranging from activation, demonstration, practice, application, assessment, and integration”
-
Age-Appropriate Engagement: Feedback confirmed the approach resonates with target demographic, with specific requests for “appealing for kids our age in general”
-
Problem Identification Clarity: Issues identified are implementation challenges rather than fundamental concept flaws - students requested better navigation and visual appeal, not different educational approaches
-
Positive-to-Negative Feedback Ratio: Constructive improvement suggestions (navigation flow, visual design) vastly outnumber fundamental objections to the quest methodology
Development Readiness Criteria Met
-
Proof of Concept Validation: Core educational hypothesis confirmed through measurable learning outcomes
-
Technical Infrastructure Viability: AI tools, multimedia integration, and cross-platform functionality demonstrated sufficient stability for production development
-
User Acceptance Foundation: Strong user engagement and comprehension rates provide solid foundation for feature expansion
-
Instructor Workflow Validation: C5/C6 modules proved the instructor evaluation and student certification systems can streamline classroom implementation
-
Scalability Evidence: Student feedback includes specific design elements they want to “implement into our own design,” confirming the quest framework can be replicated across subjects
Development Phase Priorities Based on Testing
The transition to development should prioritize backend infrastructure supporting: - User Role Management: Student and instructor authentication with appropriate access controls - Data Persistence: Student progress tracking, instructor feedback systems, and certification workflows - Performance Optimization: Addressing identified AI tool response times and mobile experience improvements - Navigation Enhancement: Implementing the frequently requested “next button” functionality and progress indicators - Visual Design Refinement: Age-appropriate interface improvements that emerged as top priority from student feedback
Decision Rationale
The positive-to-negative feedback ratio, combined with 86.4% educational concept validation and 72.7% user satisfaction ratings, provides clear evidence that the Plagiarism Prevention Quest prototype has successfully validated its core educational approach and user experience framework. All identified issues represent implementation optimizations rather than fundamental design flaws, making this an ideal candidate for full development phase with backend infrastructure integration.
Economic Justification for Development Transition
Further prototype testing would yield diminishing returns at this stage, as the core usability and educational effectiveness have been validated. The cost-benefit analysis strongly favors moving to development:
-
Testing Limitations: Prototype testing cannot adequately validate role-based authentication, data persistence, or instructor workflow efficiency - all critical for production viability
-
C3 Module Optimization: Identified weaknesses in the Error Correction module (C3) require real-time data updates and dynamic content delivery that can only be properly tested in a production environment with live databases
-
Backend Infrastructure Dependencies: Key features like automated grading (C5) and certification systems (C6) require full database integration and user role management that cannot be meaningfully tested in prototype form
-
Real-World Data Requirements: Effective testing of citation tools and error correction functionality requires access to current academic databases and dynamic content that prototype testing cannot simulate
-
Development Efficiency: Resources are better allocated to building production infrastructure rather than conducting additional prototype testing that cannot address the identified technical limitations
Production Testing Strategy
The transition to development enables more effective testing approaches: - Incremental Feature Testing: Real system allows testing of individual components as they are built - Live Data Validation: C3 error correction can be refined using actual academic content and citation databases - User Role Testing: Authentic instructor and student role testing with real data persistence - Performance Optimization: True load testing and system performance evaluation under realistic conditions
Success Measurement Framework
-
Follow-Up Testing Protocol: Plan for validation testing of implemented improvements
-
Continuous Feedback Mechanism: Establish ongoing channels for user input and system monitoring
-
Iteration Planning: Create framework for regular improvement cycles based on usage data
-
Knowledge Transfer Documentation: Capture lessons learned for application to future educational technology projects
Risk Mitigation Strategy
-
Implementation Risks: Identify potential issues with proposed changes and develop contingency plans
-
Resource Allocation: Ensure development capacity matches ambitious improvement timeline
-
User Adoption: Plan for introducing changes in ways that don’t disrupt ongoing educational use
-
Quality Assurance: Establish testing protocols to prevent new issues from emerging during improvement process
This comprehensive post-test process ensures that valuable user feedback translates into concrete improvements while maintaining focus on educational effectiveness and user experience excellence.
L. Acknowledgment of Sources
No sources used outside of WGU-provided materials. Sources used in visuals are self-contained and managed outside of this document.